Project Overview
Built a production-grade CI/CD pipeline for literature-app that combines security scanning at every stage with a Blue-Green deployment strategy on Azure Kubernetes Service—achieving zero-downtime releases with automated rollback capability.
Architecture
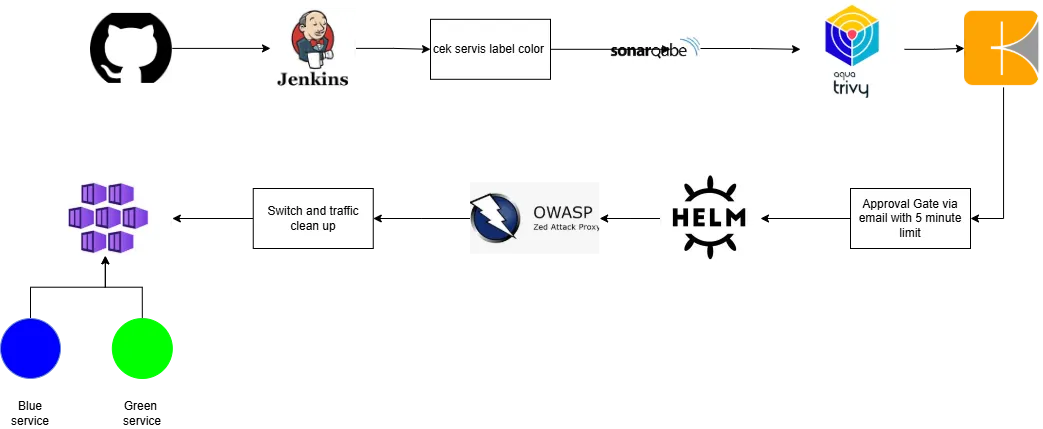
Code Push (GitHub) → Jenkins (on K8s)
    │
    ├── Stage 0: Identify active color (blue/green)
    ├── Stage 1: Fetch Code (alpine/git)
    ├── Stage 2: SAST — SonarQube Analysis
    ├── Stage 3: SCA — Trivy Filesystem Scan
    ├── Stage 4: Build & Push — Kaniko → Docker Hub
    ├── Stage 5: Manual Approval Gate (5 min timeout)
    ├── Stage 6: Deploy to target color (Helm)
    ├── Stage 7: DAST — OWASP ZAP Baseline Scan
    └── Stage 8: Traffic Switch (kubectl patch) & Cleanup
Pipeline Agent — Kubernetes Pod Template
Jenkins dynamically spins up a pod with all required tooling:
agent {
    kubernetes {
        label "refa-devops-${UUID.randomUUID().toString()}"
        yaml '''
apiVersion: v1
kind: Pod
spec:
  containers:
  - name: git-tool
    image: alpine/git:latest
    command: [cat]
    tty: true
  - name: trivy
    image: aquasec/trivy:0.49.1
    command: [sleep]
    args: [9999999]
  - name: kaniko
    image: gcr.io/kaniko-project/executor:debug
    command: [sleep]
    args: [9999999]
  - name: jnlp
    image: jenkins/inbound-agent:latest
  - name: helm-tool
    image: dtzar/helm-kubectl:latest
    command: [sleep]
    args: [9999999]
  - name: zap
    image: ghcr.io/zaproxy/zaproxy:stable
    imagePullPolicy: IfNotPresent
    command: [sleep]
    args: [9999999]
'''
    }
}
Each container serves a specific purpose—no bloated monolithic build agent.
Stage 0: Identify & Validate Active Environment
stage('0. Identify & Validate Status') {
    steps {
        container('helm-tool') {
            script {
                echo "[INFO] Detecting active environment color..."
                def currentColor = sh(
                    script: "kubectl get svc literature-app-service -n jenkins -o jsonpath='{.spec.selector.color}' || echo 'none'",
                    returnStdout: true
                ).trim()

                if (currentColor == 'green') {
                    def greenStatus = sh(
                        script: "kubectl get pods -l color=green -n jenkins -o jsonpath='{.items[0].status.phase}' || echo 'NotFound'",
                        returnStdout: true
                    ).trim()
                    if (greenStatus != 'Running') {
                        error "[ERROR] Green environment state is '${greenStatus}'. Halting."
                    }
                    env.TARGET_COLOR = 'blue'
                    env.PREVIOUS_COLOR = 'green'
                }
                else if (currentColor == 'blue') {
                    env.TARGET_COLOR = 'green'
                    env.PREVIOUS_COLOR = 'blue'
                }
                else {
                    env.TARGET_COLOR = 'green'
                    env.PREVIOUS_COLOR = 'none'
                }
                echo "[STATUS] Target: ${env.TARGET_COLOR} | Previous: ${env.PREVIOUS_COLOR}"
            }
        }
    }
}
The pipeline auto-detects which slot is active and deploys to the opposite — no manual color selection needed.
Stage 2: SAST — SonarQube Analysis
stage('2. SAST (SonarQube)') {
    steps {
        container('jnlp') {
            script {
                def scannerHome = tool 'SonarScanner'
                withSonarQubeEnv('sonarqube') {
                    sh """
                    ${scannerHome}/bin/sonar-scanner \
                    -Dsonar.projectKey=${env.SONAR_PROJECT_KEY} \
                    -Dsonar.analysis.mode=publish

                    echo "<html><body><h1>SonarQube Scan Report</h1><a href='http://<REDACTED>:9000/dashboard?id=${env.SONAR_PROJECT_KEY}'>View Dashboard</a></body></html>" > sonar_report.html
                    """
                }
            }
        }
    }
    post {
        always { archiveArtifacts artifacts: 'sonar_report.html', allowEmptyArchive: true }
    }
}
Stage 3: SCA — Trivy Vulnerability Scan
stage('3. SCA (Trivy Scan)') {
    steps {
        container('trivy') {
            script {
                sh "trivy fs . --severity HIGH,CRITICAL --format template --template @/contrib/html.tpl --output trivy_report.html --exit-code 0"
            }
        }
    }
    post {
        always { archiveArtifacts artifacts: 'trivy_report.html', allowEmptyArchive: true }
    }
}
Stage 4: Build & Push with Kaniko
stage('4. Build & Push (Kaniko)') {
    steps {
        container('kaniko') {
            withCredentials([usernamePassword(
                credentialsId: 'DOCKERHUB_CRED',
                passwordVariable: 'DOCKER_PASSWORD',
                usernameVariable: 'DOCKER_USERNAME'
            )]) {
                sh """
                AUTH_B64=\$(echo -n "\${DOCKER_USERNAME}:\${DOCKER_PASSWORD}" | base64 | tr -d '\\n')
                echo '{"auths":{"https://index.docker.io/v1/":{"auth":"'\$AUTH_B64'"}}}' > /kaniko/.docker/config.json
                /kaniko/executor \
                    --context `pwd` \
                    --dockerfile Dockerfile \
                    --destination ${env.DOCKER_IMAGE}:${env.BUILD_NUMBER} \
                    --destination ${env.DOCKER_IMAGE}:latest
                """
            }
        }
    }
}
Using Kaniko instead of Docker-in-Docker — no privileged mode required, more secure in K8s environments.
Stage 5: Approval Gate
stage('5. Approval Gate') {
    steps {
        script {
            def authorizedUser = 'refalia'
            try {
                timeout(time: 5, unit: 'MINUTES') {
                    input message: "Authorize deployment to ${env.TARGET_COLOR}?",
                          ok: "Approve Deployment",
                          submitter: authorizedUser
                }
            } catch (err) {
                if (err.toString().contains("FlowInterruptedException")) {
                    currentBuild.result = 'ABORTED'
                    error "Deployment timeout: No response from ${authorizedUser}"
                } else {
                    throw err
                }
            }
        }
    }
}
Only refalia can approve — with a 5-minute timeout that auto-aborts if no response.
Stage 6: Deploy with Helm
stage('6. Deploy') {
    steps {
        container('helm-tool') {
            script {
                sh """
                helm upgrade --install literature-app-${env.TARGET_COLOR} ./helm-chart \
                --set image.repository=${env.DOCKER_IMAGE} \
                --set image.tag=${env.BUILD_NUMBER} \
                --set podLabels.color=${env.TARGET_COLOR} \
                --set service.enabled=false \
                --namespace jenkins
                """
            }
        }
    }
}
Note: service.enabled=false — the new color doesn’t get traffic until explicitly switched.
Stage 7: DAST — OWASP ZAP
stage('7. DAST Scan') {
    steps {
        container('zap') {
            script {
                sh "mkdir -p /zap/wrk && cd /zap/wrk && zap-baseline.py -t http://<REDACTED> -r zap_report.html -I || true"
                sh "cp /zap/wrk/zap_report.html ${WORKSPACE}/zap_report.html || true"
            }
        }
    }
    post {
        always { archiveArtifacts artifacts: 'zap_report.html', allowEmptyArchive: true }
    }
}
Stage 8: Traffic Switch & Cleanup
stage('8. Switch Traffic & Cleanup') {
    steps {
        container('helm-tool') {
            script {
                input message: "Proceed with traffic switch to ${env.TARGET_COLOR}?",
                      ok: "Confirm Switch",
                      submitter: 'refalia'

                // Zero-downtime traffic switch
                sh "kubectl patch svc literature-app-service -n jenkins -p '{\"spec\":{\"selector\":{\"color\":\"${env.TARGET_COLOR}\"}}}'"

                // Cleanup old environment
                sh "helm uninstall literature-app-${env.PREVIOUS_COLOR} -n jenkins || true"
            }
        }
    }
}
One kubectl patch command = instant traffic switch. Old slot gets cleaned up with helm uninstall.
Blue-Green Flow Diagram
                  ┌──────────────┐
                  │   Service    │
                  │  (selector)  │
                  └──────┬───────┘
                         │
            ┌────────────┼────────────┐
            │            │            │
   ┌────────▼─────┐           ┌─────▼────────┐
   │  BLUE slot   │           │  GREEN slot  │
   │  (previous)  │           │  (target)    │
   │              │           │              │
   │  helm:       │           │  helm:       │
   │  literature- │           │  literature- │
   │  app-blue    │           │  app-green   │
   └──────────────┘           └──────────────┘
         │                          │
         ▼                          ▼
   helm uninstall            receives traffic
   (after switch)            (after patch)
Security Reports Generated
Every pipeline run produces 3 archived HTML reports:
| Report | Tool | Purpose |
|---|---|---|
sonar_report.html | SonarQube | Code quality + vulnerabilities (SAST) |
trivy_report.html | Trivy | Filesystem dependency vulnerabilities (SCA) |
zap_report.html | OWASP ZAP | Runtime web app vulnerabilities (DAST) |
Results
| Metric | Before | After |
|---|---|---|
| Deployment downtime | 2-5 min | 0 seconds |
| Security scan coverage | None | SAST + SCA + DAST |
| Rollback time | 10-15 min | Instant (patch back) |
| Approval control | None | User-gated + timeout |
Tech Stack
- CI/CD: Jenkins on Kubernetes (dynamic pod agents)
- Security: SonarQube (SAST), Trivy v0.49.1 (SCA), OWASP ZAP (DAST)
- Build: Kaniko (rootless container builds)
- Deploy: Helm Charts + kubectl patch
- Orchestration: Azure Kubernetes Service (AKS)
- Registry: Docker Hub
- App: literature-frontend (React)